Measuring background impact on performance
Task-irrelevant backgrounds can substantially affect robot performance and cause failures.
Offline comparisons and attention maps can reveal which backgrounds are harmful and why, and give a signal on where a policy can be improved.
Same task, different backgrounds, different outcomes
Task 1: pick up the black bowl next to the ramekin and place it on the plate. Both transformed rollouts start from the same clean simulator state.
Hold the task, camera, robot, and simulator state fixed.
Preserve the robot and task-relevant objects; replace everything else with the selected background.
Predict and execute 50 actions, then re-observe the actual state.
What backgrounds make the model fail?
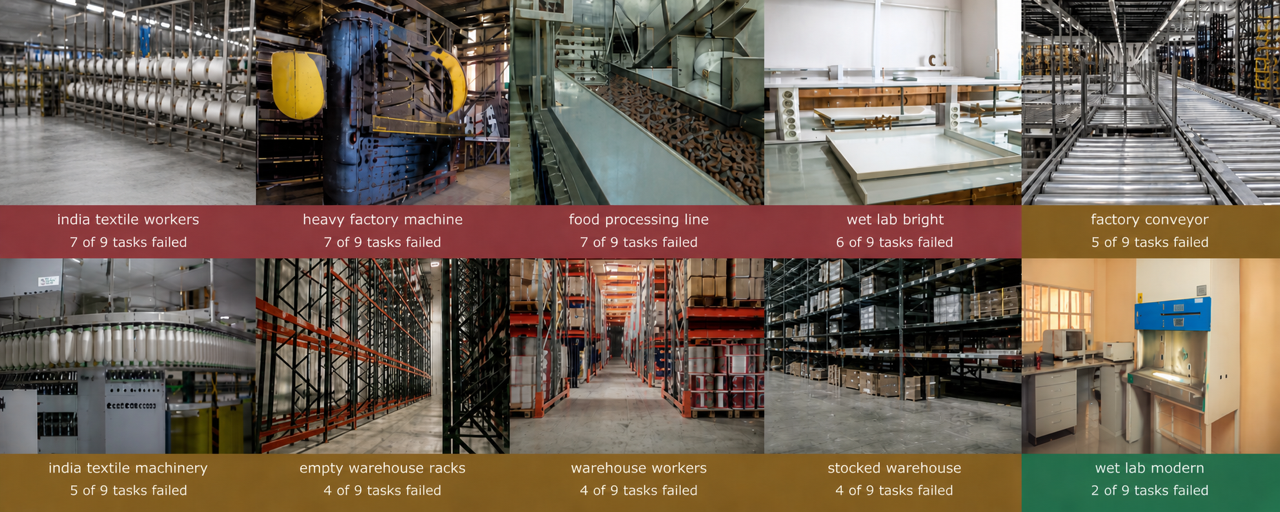
We ran this experiment across all 10 LIBERO-Spatial tasks. The policy succeeded on 9 of 10 clean task rollouts. Across those same clean-success tasks, replacing the non-task background caused 51 failures across 90 matched rollouts, reducing observed success to 43%.
9 of 10 clean task rollouts succeeded. Please note, Pi0.5 executes 50 actions per inference, increased from the published 10, to reduce the impact of repeated model-inference drift on the comparison.
39 of 90 matched transformed rollouts succeeded.
india textile workers, heavy factory machine, food processing line: 2 of 9 tasks succeeded when these backgrounds were used.
wet lab modern: 7 of 9 tasks succeeded with this background.

Why do they fail?
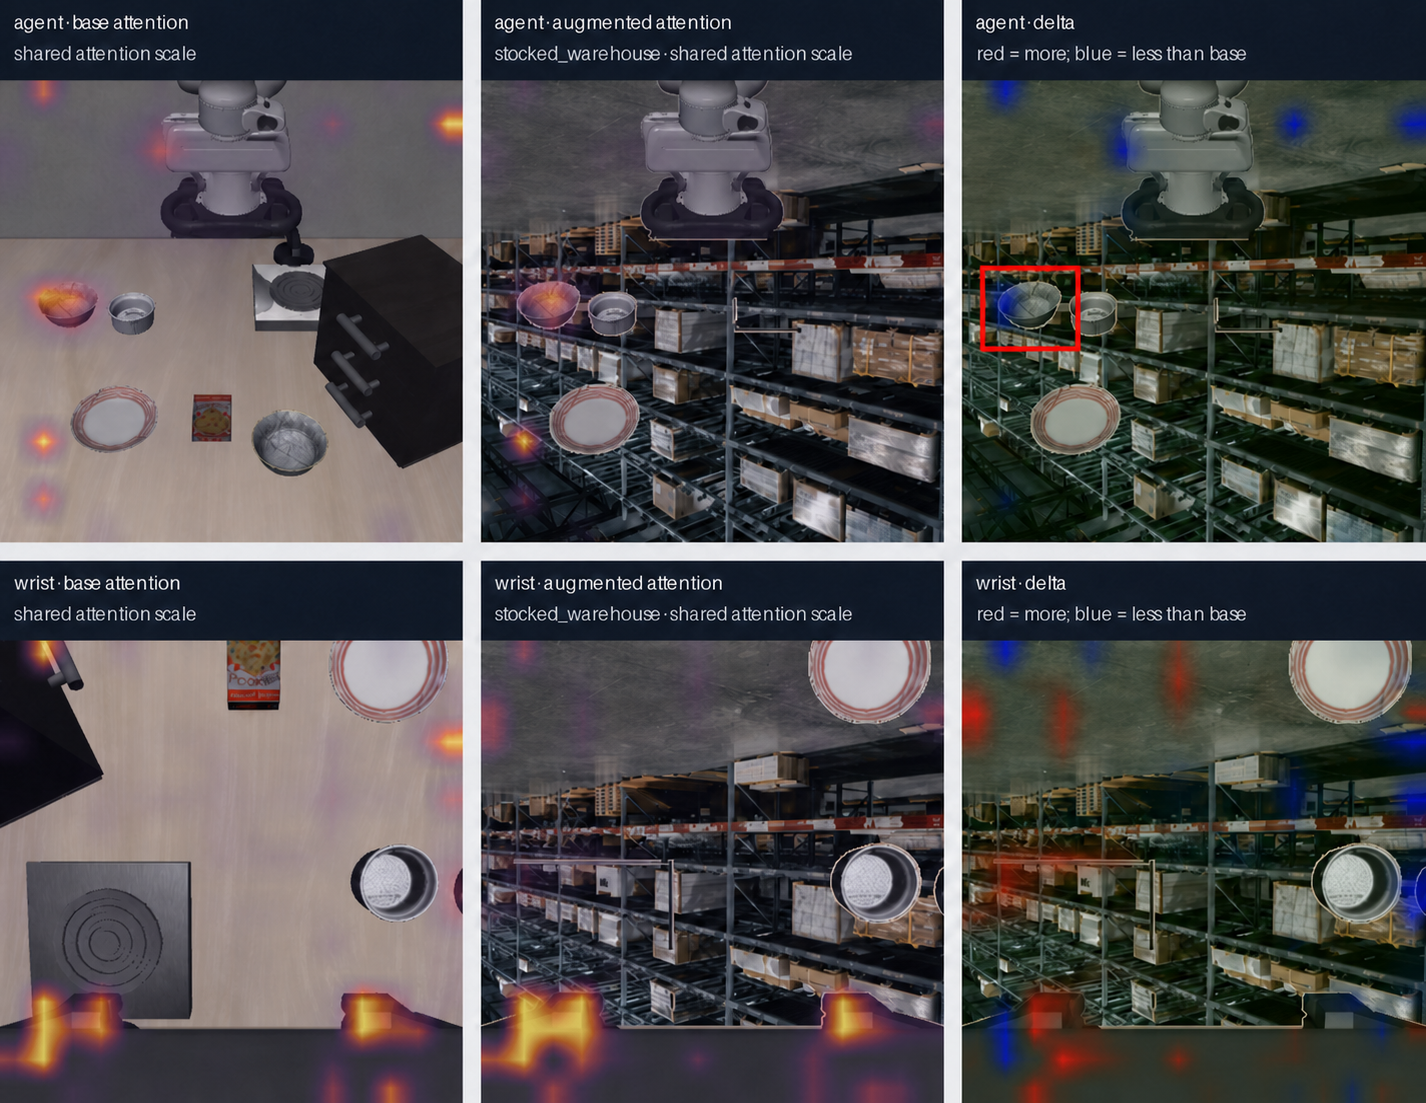
We analyze a failed example to see whether we can gain insight into what caused the failure. In this example, attention on the bowl's edge drops under the replaced background, and the rollout ultimately misses the bowl. Other attention differences are sporadic.
Can we see this without running more rollouts?
We tested whether the outcome of an expensive closed-loop rollout (simulated in this case) can be estimated from model predictions alone, without executing a new trajectory. We find a high correlation between Acc@.1 measured without rollouts and success rates from full closed-loop rollouts, when averaged across backgrounds.
How the offline comparison works
Start from saved states along a successful baseline rollout. At each frozen state, query Pi0.5 twice: once with the baseline images and once from the same state with the backgrounds replaced. Compare the two predicted 50-step action sequences without executing either sequence in the simulator.
What Acc@.1 measures
Acc@.1 is the fraction of the 50 × 7 predicted action values whose clean and replaced-background predictions differ by no more than 0.1 normalized action units. Higher Acc@.1 means the background replacement changed fewer predicted actions.
Why this matters for real-world deployments
Real-world rollouts are expensive to collect and often do not cover the full range of scenarios a deployment will face. By augmenting the visual cues in existing rollouts, we can expose the model to a higher degree of environmental complexity without physically changing the environment or running more rollouts. This extracts meaningful signals about where a policy may fail and what data would be most beneficial for improving the model.